92% of SaaS startups fail within three years. And while most founders blame their product, the data tells a different story roughly 42% of those failures come from building something nobody actually needs, and another 13% from poorly executed go-to-market strategies (CB Insights, Startup Genome). The product was often fine. The GTM was broken.
This isn’t another fluffy “5 pillars” overview. This is the operational GTM template we use internally at WitsCode when helping SaaS companies plan their market entry rebuilt for 2026 with current benchmarks, real company breakdowns, and frameworks you can execute this week.
Bookmark this page. You’ll come back to it.
What a SaaS Go-To-Market Strategy Actually Is (and What It Isn’t)
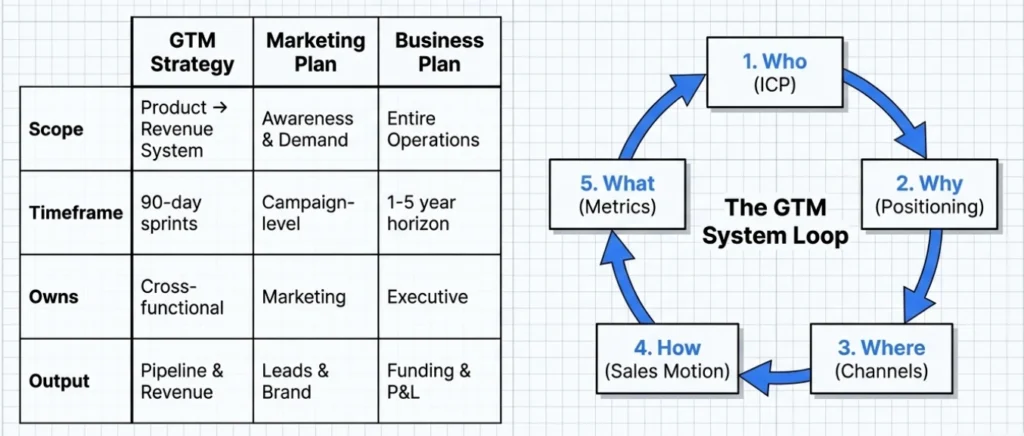
A go-to-market strategy is your system for turning a product into revenue. It answers five questions in sequence:
- Who is the buyer? (ICP)
- Why should they care? (Positioning)
- Where do they hang out? (Channels)
- How do we convert them? (Sales motion)
- What does success look like? (Metrics)
A common mistake founders make: treating GTM as a marketing plan. It’s not. Marketing is one channel within GTM. Your go-to-market strategy encompasses your pricing model, sales motion, product decisions, positioning, channel mix, and feedback loops all working together.
Think of it this way: Marketing tells people your product exists. GTM is the entire system that turns a stranger into a paying, retained customer.
GTM Strategy vs. Marketing Plan vs. Business Plan
| GTM Strategy | Marketing Plan | Business Plan | |
|---|---|---|---|
| Scope | Product → Revenue system | Awareness & demand gen | Entire business operations |
| Timeframe | 90-day sprints, quarterly review | Campaign-level (weeks/months) | 1-5 year horizon |
| Owns | Cross-functional (Product, Sales, Marketing, CS) | Marketing team | Executive/founders |
| Key output | Pipeline velocity & revenue | Leads & brand awareness | Funding, P&L, strategy |
The 2026 SaaS GTM Landscape: What’s Changed
Before diving into the framework, it’s important to understand the macro context. The SaaS GTM environment in 2026 looks fundamentally different from even two years ago.
The Numbers That Matter
- SaaS companies raised over $43 billion in 2025 and the sector spans everything from vertical software to AI-native applications (Growth List).
- Inbound remains the most adopted GTM motion at 23%, but there’s no correlation between GTM motion and growth rate execution quality matters more than motion selection (2025 B2B GTM Benchmarks).
- SEO/organic search delivers ~748% ROI for thought leadership campaigns with approximately 9-month breakeven periods (Digital Bloom GTM Report).
- Content marketing generates roughly 3x more qualified leads than outbound SDR calls on average, and organic search drives 30–60% of SaaS pipeline (industry benchmarks).
- 67% of B2B buyers prefer self-serve evaluation before talking to sales making your content, docs, and trial experience your real “first sales rep.”
- Over 80% of mid-market SaaS buying decisions are finalized within six months, and buyers often bypass early vendor contact entirely (G2 Learn).
The Three Big Shifts
1. AI Has Rewritten Discovery G2 reports that AI-powered search now rivals or surpasses Google for enterprise software discovery. Leads from AI search convert 40% better than traditional search. Your GTM content needs to be structured for AI retrieval, not just traditional SEO.
2. Expansion > Acquisition The most efficient GTM teams are shifting from acquisition-at-all-costs to account-based expansion. Net Revenue Retention (NRR) is now the metric investors care about most. Best-in-class NRR benchmarks: SMB 110–120%, Mid-market 120–130%, Enterprise 130%+ (industry data).
3. Single-Channel Outbound is Dead Omnichannel is the baseline in 2026. Top-performing teams orchestrate LinkedIn, email, phone, and paid media with precision sequencing not isolated blasts.
Phase 1: Define Your Ideal Customer Profile (ICP)
Every failed GTM we’ve audited shares one trait: a vague ICP. “Any company that needs project management” isn’t an ICP. It’s a wish.
The ICP Definition Framework
Your ICP needs to be specific across three dimensions:
Firmographic Layer (Company-level)
- Industry vertical(s)
- Company size (employees and/or revenue)
- Growth stage (pre-seed to enterprise)
- Tech stack indicators
- Geography
Demographic Layer (Buyer-level)
- Job title / role
- Seniority level
- Department
- Reporting structure
- Budget authority
Psychographic Layer (Behavior-level)
- What tools are they currently using?
- What’s the “trigger event” that makes them search?
- Where do they seek information?
- What buying objections will they have?
- What’s their decision timeline?
ICP Validation Process (The 15-Interview Method)
Don’t guess your ICP. Validate it.
- Identify 15 potential buyers 5 from your existing customers (if any), 5 from competitor customers, 5 from your target market
- Run problem discovery interviews (30 min each). Ask:
- “Walk me through how you currently handle [problem area].”
- “What’s the most frustrating part of that process?”
- “What have you tried before to fix it?”
- “If you could wave a magic wand, what would change?”
- “How much time/money does this problem cost you monthly?”
- Look for patterns. If 8+ of 15 describe the same pain, you have signal.
- Document your ICP card a single-page reference your entire team uses.
ICP Card Template
ICP: [Name this segment]

COMPANY: [Industry] companies with [X-Y employees], [$X-Y ARR],
         using [current tools], based in [geography]

BUYER:   [Title] at [Department], reports to [who],
         controls [budget range]

TRIGGER: They start looking when [specific event happens]

PAIN:    Their current solution fails because [specific frustration]

DREAM:   They want [specific outcome with measurable improvement]

PROOF:   They'll believe us because [evidence/social proof]
Example (real pattern we see):
ICP: "Growth-stage B2B SaaS marketing teams"

COMPANY: B2B SaaS companies with 15-75 employees, $1-10M ARR, currently using spreadsheets or Asana/Monday for content ops, based in US/UK/Canada.

BUYER: Head of Marketing or Content Lead, reports to VP Marketing or CMO, controls $5-15K/month tool budget.

TRIGGER: They just hired their 3rd content writer and their spreadsheet-based workflow is breaking down.

PAIN: Content bottlenecks cause missed publish dates, version chaos, and zero visibility into what's working.

DREAM: Ship 2x more content with the same team size, with clear attribution to pipeline.

PROOF: Case study from a similar-stage company showing measurable improvement.
Phase 2: Positioning That Actually Differentiates
Positioning is not your tagline. It’s the strategic decision about what space you’ll own in your buyer’s mind — and more importantly, what you’ll say no to.
The Positioning Canvas
Use this fill-in framework to draft your positioning:
For [TARGET CUSTOMER]
Who [SPECIFIC PROBLEM/SITUATION]
[PRODUCT] is a [CATEGORY]
That [PRIMARY BENEFIT the one thing]
Unlike [PRIMARY ALTERNATIVE]
We [UNIQUE MECHANISM/PROOF]
The key word here is unlike. If your positioning doesn’t explicitly name what you’re replacing and why you’re different, it’s not positioning it’s a feature list.
Messaging Hierarchy
Once positioning is locked, build your messaging in layers:
Level 1 — Value Proposition (1 sentence) The core promise. Used on your homepage hero, in pitch decks, and in the first line of cold emails.
Level 2 — Key Benefits (3–5 bullets) The primary outcomes buyers get. These become your landing page sections and sales deck slides.
Level 3 — Supporting Proof (per benefit) Case studies, data points, third-party validation, or product demonstrations that make each benefit believable.
Level 4 — Objection Handling (top 5) The specific concerns your ICP will raise, paired with responses. These become your FAQ section, sales battle cards, and SDR training material.
Positioning Audit Checklist
Run your positioning through these five tests:
- [ ] Clarity Test: Can a stranger understand what you do in 5 seconds?
- [ ] Differentiation Test: Is this clearly different from the top 3 alternatives?
- [ ] Resonance Test: Does it reference a real pain your ICP has expressed?
- [ ] Credibility Test: Is it believable given your current stage and proof?
- [ ] Specificity Test: Does it name a specific audience, not “businesses”?
If you fail any one of these, rewrite before moving to channels.
Phase 3: Channel Strategy Go Deep, Not Wide
This is where most SaaS companies bleed money. They try to be on every channel simultaneously and end up mediocre everywhere.
The data is clear: early-stage SaaS companies should master 1–2 channels before expanding. The 2025 B2B GTM Benchmarks report shows there’s no correlation between how many channels you use and your growth rate execution depth is what matters.
Channel Selection Matrix
For each potential channel, score it 1-5 on these criteria:
| Criteria | Question | Weight |
|---|---|---|
| ICP Presence | Is my buyer actively here? | 5x |
| Intent Signal | Are they in buying mode here? | 4x |
| Competition | How crowded is this channel? | 3x |
| Cost | What’s the expected CAC? | 3x |
| Speed | How fast can results materialize? | 2x |
| Resources | Can we execute well with our team? | 4x |
Score each channel, multiply by weight, and focus on the top 1-2.
The Four GTM Motions for SaaS
Choose your primary motion first this determines which channels matter most.
1. Product-Led Growth (PLG) The product itself drives acquisition and conversion. Users experience value before (or without) talking to sales.
Best for: Low complexity, <$500/month ACV, clear immediate value Examples: Slack’s freemium + viral team invites. Loom’s view-before-signup loop. Notion’s template-driven community growth. Key channels: Product experience, referral loops, SEO/content, community, Product Hunt Key metric: Product-Qualified Leads (PQLs), activation rate, time-to-value
2. Sales-Led Growth (SLG) Sales team guides prospects through evaluation and purchase.
Best for: Complex products, >$10K ACV, multiple stakeholders, enterprise deals Examples: Workday’s cloud-based alternative to legacy ERP. Salesforce’s enterprise consultative selling. Key channels: Outbound prospecting, events/conferences, partner referrals, ABM Key metric: SQL-to-close rate, deal velocity, ACV
3. Inbound/Content-Led Growth Educational content attracts and qualifies buyers before they ever talk to you.
Best for: Products in categories with high search demand, $1K–$50K ACV, longer consideration cycles Examples: HubSpot’s blog and certification ecosystem grew their customer base from 8,200 in 2012 to over 205,000 by end of 2023 with 20-25% YoY revenue growth. Ahrefs using their own product to dominate SEO content. Key channels: SEO, blog, webinars, podcasts, YouTube, gated resources Key metric: Organic traffic, content-to-MQL conversion, organic pipeline %
4. Community-Led Growth Users become advocates who create content, share templates, and drive adoption.
Best for: Products with network effects, user-generated content potential, horizontal use cases Examples: Notion’s community of creators and template builders. Figma’s design community driving bottom-up adoption. Key channels: Community platforms, user-generated content, ambassadors, social proof Key metric: Community-sourced pipeline, NPS, organic mentions
Hybrid Approach: The Reality for Most Companies
Most SaaS companies between $1M–$10M ARR end up with a hybrid. A common pattern: PLG for SMB customers (self-serve signup, freemium/trial) with a sales-assist layer for mid-market, and enterprise sales for large deals.
The key is to nail one motion first, then layer.
Phase 4: The 90-Day GTM Launch Plan
A launch isn’t a single day it’s a 90-day sprint broken into three phases.
Days 1–30: Foundation
Week 1–2: Research Lock
- [ ] Finalize ICP card (validated with interviews)
- [ ] Complete competitive analysis (top 5 competitors)
- [ ] Map competitor positioning where’s the gap?
- [ ] Document buyer journey from trigger to purchase
Week 3–4: Strategy Lock
- [ ] Lock positioning canvas
- [ ] Build messaging hierarchy (all 4 levels)
- [ ] Select primary GTM motion
- [ ] Select primary + secondary channels
- [ ] Define pricing model and tiers
- [ ] Set up analytics/attribution (GA4, Amplitude, or Mixpanel)
Days 31–60: Build
Week 5–6: Assets
- [ ] Homepage + core landing pages live with positioning-aligned copy
- [ ] Demo/signup/trial flow tested end-to-end
- [ ] 3-5 pieces of foundational content published (SEO-targeted)
- [ ] Email nurture sequences built (onboarding + lead nurture)
- [ ] Sales deck and battle cards ready
Week 7–8: Infrastructure
- [ ] CRM configured with pipeline stages
- [ ] Lead scoring model defined
- [ ] Outbound sequences loaded (if SLG/outbound motion)
- [ ] Social profiles active with content calendar
- [ ] Beta users onboarded, collecting feedback
Days 61–90: Execute & Iterate
Week 9–10: Launch
- [ ] Pre-launch buzz (private beta announcements, LinkedIn posts, community seeding)
- [ ] Launch execution (Product Hunt, email blast, social push, PR if applicable)
- [ ] Immediate post-launch optimization (monitor signup flow, fix friction)
Week 11–12: Learn & Double Down
- [ ] Collect first 10-20 customer feedback calls
- [ ] Identify top-performing channel (by pipeline, not just traffic)
- [ ] Kill underperforming activities
- [ ] Double investment in what’s working
- [ ] Update messaging based on customer language
Phase 5: The GTM Metrics Dashboard
You can’t improve what you don’t measure. But most SaaS companies track too many metrics and act on too few.
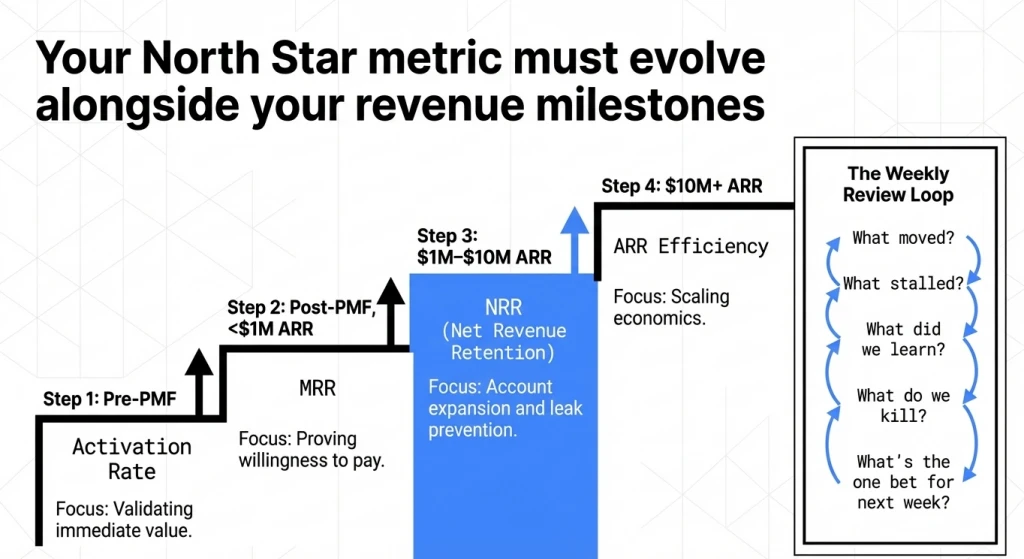
Pick One North Star Metric
This is the single metric that best represents your business health. Choose based on your stage:
- Pre-PMF: Weekly active users or activation rate
- Post-PMF, pre-$1M ARR: Monthly recurring revenue (MRR)
- $1M–$10M ARR: Net Revenue Retention (NRR)
- $10M+ ARR: Annual Recurring Revenue (ARR) efficiency
The Metrics That Actually Matter
Acquisition Metrics
- CAC (Customer Acquisition Cost): Total sales + marketing spend ÷ new customers. Average SaaS CAC payback is 12–24 months (industry data). If yours is longer, your unit economics don’t work.
- Pipeline Velocity: (Number of qualified opps × avg deal size × win rate) ÷ sales cycle length. This is the single best predictor of revenue growth.
- Channel-Level CAC: Break down CAC by channel. Not all channels are equal organic search CAC is typically 2-5x lower than paid acquisition.
Activation Metrics
- Time-to-Value (TTV): How quickly do new users reach their “aha moment”? This is probably the most underrated metric in SaaS.
- Activation Rate: % of signups who complete key onboarding actions. SaaS onboarding experience influences approximately 75% of churn risk.
- PQL Conversion: % of product-qualified leads who convert to paid.
Retention Metrics
- Logo Churn: % of customers lost per period. Benchmarks: Enterprise 5–8% annually, SMB 15–30% annually.
- Net Revenue Retention (NRR): Revenue from existing customers including expansion minus churn. Best-in-class: 120-140%+. This is the metric that separates good SaaS from great SaaS.
- Expansion MRR: Revenue from upgrades/cross-sells within existing accounts.
Efficiency Metrics
- LTV:CAC Ratio: Lifetime value ÷ acquisition cost. Aim for 3:1 or better.
- Magic Number: Net new ARR ÷ prior period sales & marketing spend. Above 0.75 = efficient growth.
- Payback Period: Months to recoup CAC. Under 18 months is healthy.
Weekly GTM Review Template
Every week, ask these five questions:
- What moved? Which metric improved most this week and why?
- What stalled? Which metric flatlined or declined?
- What did we learn? What customer feedback or data surprised us?
- What do we kill? What activity isn’t producing results?
- What’s the one bet? What single action would have the highest impact next week?
SaaS GTM Case Studies: What Actually Worked
Theory is useful. Execution examples are better. Here’s how four companies executed GTM motions that drove real growth.
Slack: PLG Through Engineered Virality
Slack didn’t just offer a free tier they engineered team-level adoption. A single user signs up, invites teammates, and the product spreads through the organization without executive or IT approval. Key elements: freemium model with generous free features, a product designed for team collaboration that creates natural invite loops, integration-first approach that embedded Slack into existing workflows, and bottom-up adoption targeting individual teams rather than enterprise-wide deals.
HubSpot: Content as the GTM Engine
HubSpot essentially invented inbound marketing as a GTM motion. They produced blog posts, ebooks, certifications, and free tools at massive scale. Search for almost any marketing or sales topic HubSpot is likely in the top 10 results. Their free CRM drove acquisition, and educational content drove upgrades. The result: sustained 20-25% year-over-year revenue growth and a massive competitive moat.
Notion: Community-Led Template Economy
Notion’s GTM leaned on community building and product versatility. They positioned as a flexible all-in-one tool replacing multiple solutions. User-generated templates became both SEO fuel and product demonstrations. Their Product Hunt launches in 2016 and 2018 both won #1 Product of the Day, Week, and Month. When launching Notion AI, they used a private alpha release where inviting others shortened your wait time driving engineered virality.
Loom: Viral Before Signup
Loom’s genius was that recipients experienced product value before signing up. Someone shares a Loom video, the viewer watches it, and sees a prompt to create their own. During COVID-19, this loop exploded Loom reported 1,100% revenue growth in 2020 and reached 25 million users by 2023. Their Product Hunt launch in 2016 drove 3,000 signups on day one.
The 12 GTM Mistakes That Kill SaaS Companies
These aren’t theoretical they’re patterns we’ve seen repeatedly across SaaS launches.
1. No validated ICP. Trying to serve everyone means serving no one. About 42% of SaaS failures trace back to “no market need” often because the ICP was never validated.
2. Spreading across too many channels. Mediocre execution on 6 channels loses to excellent execution on 1-2. Master a channel before expanding.
3. “We’re like X but better” positioning. This is not differentiation. Strong positioning requires specificity about who you’re for, what problem you solve, and what makes your approach unique.
4. Launching without validation. Build → launch → hope is not a strategy. Talk to buyers before you build, and validate willingness to pay before you launch.
5. No measurement plan. “Let’s see what happens” leads to expensive learning. Define your North Star and leading indicators before launch day.
6. Ignoring distribution. Great products with poor distribution lose to decent products with excellent distribution. Every time.
7. Leading with features instead of outcomes. Buyers don’t care about your feature list. They care about the problem you solve and the outcome you deliver. Lead with pain and transformation, not specs.
8. Skipping competitive analysis. Understanding how competitors position themselves reveals gaps you can exploit. Willful ignorance isn’t a competitive advantage.
9. No sales enablement. Even with PLG, you’ll have sales conversations. Arm your team with battle cards, objection handling, and competitive positioning.
10. Wrong pricing model. Pricing affects who you attract, how you sell, and how much you can invest in acquisition. SaaS companies using usage-based pricing (UBP) have grown from 30% to approximately 48% adoption since 2020. Test before committing.
11. Treating GTM as a static document. The best SaaS operators review and evolve their GTM quarterly. Markets shift, competitors move, and your product evolves your GTM should too.
12. Hiring too many sales reps before product-market fit. Scaling a broken process just burns cash faster. Get to repeatable sales with founders first, then hire.
Recommended GTM Tools by Category
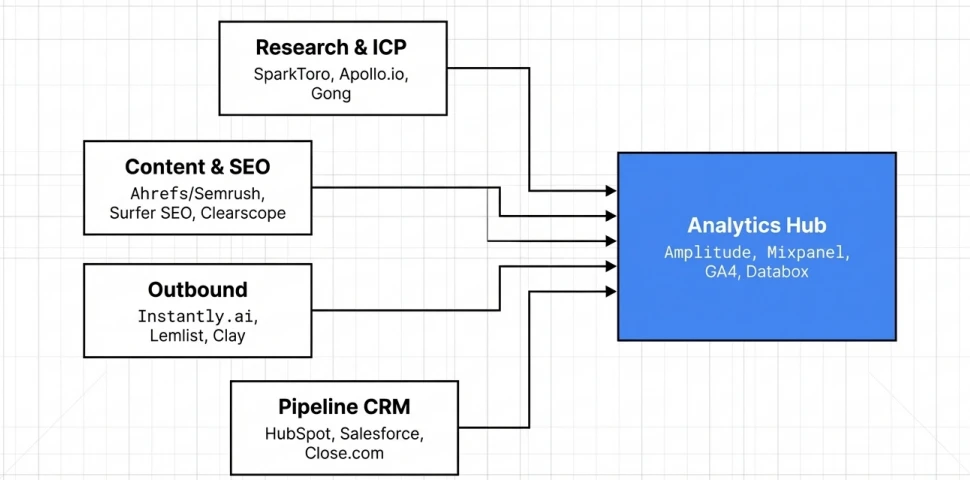
Research & ICP Development
- SparkToro — Audience research and channel identification
- Apollo.io — Prospecting data and outbound sequencing
- Gong — Competitive intelligence from sales conversations
- LinkedIn Sales Navigator — Targeted outreach and account mapping
CRM & Pipeline
- HubSpot CRM — Free tier with marketing automation (great for <$5M ARR)
- Salesforce — Enterprise CRM with advanced pipeline management
- Close.com — Built for high-velocity inside sales teams
Analytics & Attribution
- Amplitude — Product analytics and behavioral cohorts
- Mixpanel — Event tracking and funnel analysis
- Google Analytics 4 — Website analytics and attribution
- Databox — GTM dashboard aggregation
Content & SEO
- Ahrefs / Semrush — Keyword research and competitive SEO analysis
- Surfer SEO — Content optimization at the page level
- Clearscope — Content intelligence for topical authority
Outbound & Automation
- Instantly.ai — Cold email infrastructure and sequences
- Lemlist — Personalized outbound at scale
- Clay — Data enrichment and workflow automation
FAQ: SaaS Go-To-Market Strategy
How long should GTM planning take before launch?
Plan 4–8 weeks for strategy work before launch execution begins. Rushing this phase leads to expensive course corrections. Your 90-day execution plan should start only after ICP validation and positioning are locked.
What’s the minimum budget to launch a SaaS GTM strategy?
You can launch with near-zero budget if you’re willing to invest founder time. Many successful SaaS companies started with founder-led sales and organic content before investing in paid acquisition. The most critical investment is your time in customer conversations, not your ad spend.
When should I consider hiring a GTM consultant?
Consider external help if you’re a first-time founder new to GTM, entering an unfamiliar market segment, or struggling after a failed initial launch. A good consultant brings frameworks, pattern-matching from multiple launches, and an outside perspective that accelerates learning.
How do I know if my GTM strategy is working?
Early signs within 60-90 days of active execution include: prospects engaging with your content, inbound leads arriving without paid promotion, sales conversations progressing past discovery, and a consistent deal pipeline forming. If none of these are happening after 90 days, revisit your ICP and positioning something is misaligned.
How often should I update my GTM strategy?
Review quarterly for tactical adjustments (channel performance, messaging tweaks, pricing experiments). Review annually for strategic shifts (ICP expansion, new motion selection, market repositioning). Major pivots like moving from PLG to sales-led may require more frequent revision.
What’s the difference between PLG and SLG? Which should I choose?
Product-Led Growth works when your product has low complexity, clear immediate value, and an ACV under $500/month. Sales-Led Growth works when you’re selling to enterprises, dealing with multiple stakeholders, and have ACVs above $10K. Most companies between $2-10M ARR run a hybrid: PLG for smaller customers and sales-assisted for larger deals.
Should I focus on acquisition or retention first?
If you’re pre-PMF, focus on acquisition to validate demand. Once you have 50+ customers, shift attention to retention every 1% reduction in churn has compounding revenue impact. By the time you’re at $2M+ ARR, Net Revenue Retention should be your most watched metric.
Your GTM Action Plan: Start Here
Don’t try to do everything at once. Here’s the sequence:
This week: Run 3 ICP discovery calls. Talk to real buyers about their problems. Document patterns.
Week 2: Draft your ICP card and positioning canvas. Pressure-test them against what you heard in interviews.
Week 3: Score your channel options using the selection matrix. Pick your primary motion and 1-2 channels.
Week 4: Set up your metrics dashboard with your North Star and 5 leading indicators.
Week 5+: Execute your 90-day launch plan.
The unglamorous truth about successful SaaS GTM: it’s not about brilliant growth hacks or viral moments. It’s about consistent execution of fundamentals validated ICP, specific positioning, focused channel execution, and relentless measurement compounding over time.